
The True Cost of an ACH Transaction: Volume Tiers, Ancillary Fees, and Payment Rail Trade-Offs
When corporate treasury and finance teams negotiate Automated Clearing House (ACH) agreements, the conversation almost universally revolves around a single headline metric: the originated-item fee. Securing a rate between 1 and 3 cents per item is frequently viewed as a benchmark victory. However, empirical analysis of over 2.5 million monthly US bank account analysis statements across more than 300 companies and 50 banks reveals a critical reality: the base originated-item fee accounts for only 34% to 40% of a large originator’s total ACH bill.
Evaluating the true cost of ACH requires examining three interconnected dimensions: how monthly volume dictates base pricing across banking relationships, how ancillary issuance and exception fees multiply the effective per-item cost, and how ACH compares against paper checks and wire transfers in both bank fees and total operational overhead.
1. Volume-Tier Dynamics: How Scale Drives Base Item Pricing
ACH pricing is negotiated at the company–bank relationship level across all accounts rather than per individual account. Because banks price aggressively for scale, quoting a single ‘corporate median’ (which sits at 8.0¢ across all companies, or 6.2¢ among companies paying over $1M in annual bank fees) is misleading. Monthly origination volume is the primary determinant of base item pricing, with 90% of observed originated items in high-volume relationships billed at 3¢ or less.
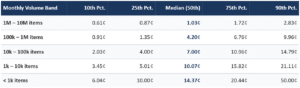
Table 1: Originated ACH item price (excluding Same-Day) by monthly company–bank relationship volume. Relationships above 10M items/month typically price between 0.3¢ and 1.1¢. Across relationships ≥ 100k items/month, originated credits (1.53¢ median) and debits (1.84¢ median) are priced closely.
Bank-Level Pricing Dispersion
Even within identical volume tiers, pricing varies meaningfully across major US cash-management banks. Among relationships originating 1 million or more items per month, Bank of America exhibits a median base item price of 0.92¢ (IQR: 0.80¢–1.09¢), JPMorgan Chase sits at 1.12¢ (IQR: 0.73¢–1.97¢), and Wells Fargo sits at 1.59¢ (IQR: 1.00¢–2.00¢), while Fifth Third and US Bank cluster around 1.0¢–1.1¢. In the broader 100k+ items/month tier, medians span from 1.03¢ at BNY and 1.12¢ at Citibank to 1.97¢ at JPMorgan Chase, 2.33¢ at Wells Fargo, 3.00¢ at Bank of America, and 5.22¢ at PNC.
2. Beyond the Headline Rate: All Costs Associated with ACH Issuance
For large originators, more than 60% of total ACH expenditure occurs outside the standard originated-item fee. Heavy debit originators—such as insurers, utilities, payroll providers, telecoms, and payment platforms—are particularly exposed to exception and remittance charges. Below is the complete cost anatomy of an ACH program across both major volume cohorts:
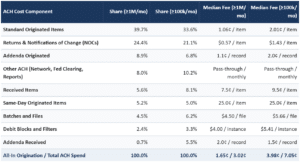
Four structural drivers explain why total ACH bills escalate so quickly beyond base item pricing:
Exception Handling (Returns & NOCs): Accounting for 21.1% to 24.4% of total spend, returns and NOCs are the single largest ancillary expense. Even a 1%–2% return rate at $0.57 to $1.43 per item adds roughly 0.6¢ to 2.8¢ per originated transaction across the entire portfolio.
Same-Day ACH Premiums: Expedited same-day settlement carries a median fee of 25.0¢ per item across large relationships (and up to 50.0¢ at the 75th percentile or for low-volume users under 1,000 items/month). Only originators sending ≥100k same-day items per month compress this median into the 5¢–6¢ range.
Remittance Data & File Transmission: Corporate B2B payments (such as CTX or CCD+ formats) frequently attach multiple addenda records at 1.1¢–2.0¢ each, while frequent small-batch transmissions incur $4.50–$5.66 per file.
Inbound Activity & Fraud Controls: Receiving ACH debits/credits costs a median of 7.5¢–9.5¢ per item (and up to 20.0¢ when fewer than 1,000 items are received monthly), alongside recurring monthly charges for debit blocks and filters ($4.00–$5.41).
3. Strategic Takeaways for Treasury Optimization
Among mega-corporations paying over $10 million in annual US bank fees, ACH accounts for a median 9.8% of total banking spend (11.7% average share, behind cash vault at 18.7% and reporting/channels at 18.5%), whereas for companies paying $1M–$10M in annual fees, ACH represents 20.4% of total spend. Regardless of company size, treasury teams looking to optimize ACH economics should focus on four levers:
Audit the Full Account Analysis Schedule (EDI 822 / camt.086):
Benchmark unit prices to the hundredth of a cent across every ACH line item—not just the originated-item code—to uncover inflated return, file, or addenda rates.
Attack Return and NOC Root Causes
Because exceptions represent nearly a quarter of large-originator spend, implementing pre-notification validation, real-time account verification, and automated NOC database updates yields immediate hard-dollar savings.